.svg)


Oversampling is often misunderstood as a research method that inserts bias into results or data. In this post, we’ll demonstrate that it is, in fact, an important and necessary tool for reducing bias in social and market research. In practice, it requires complicated mathematical calculations, but we’ll set aside the complexities for now to focus on the broad concepts.
Interpretations Are Difficult Without Oversampling
For your marketing or social research project, you might study a sample of 300 people. If we were using a truly random sample, n=300 would give us a margin of error of about 6 percentage points.
Within a sample of 300 people of the USA, there would probably be around 6 people with a PhD (2%), 24 people aged 74 or more (8%), and 45 people in 3 person households (15%). Again, assuming a truly random sample, the margin of error would be about 14 points for the subsample of 45 people in 3 person HHLDs, about 20 points for the subsample of 24 people age 74+, and about 45 points for the subsample of 6 people with PhDs.
Let’s conduct a hypothetical online survey to bring this to life. We’ve asked people whether they want brand new flavor A or brand new flavor B added to their favorite package of fruity candies. Our survey analysis tool reveals that 69% of the 300 people prefer flavor B. Knowing that sampling and non-sampling error can seep into data in many places, we use the margin of error to learn that truth is probably somewhere from 63% to 75%. We can feel confident that, overall, people prefer flavor B.
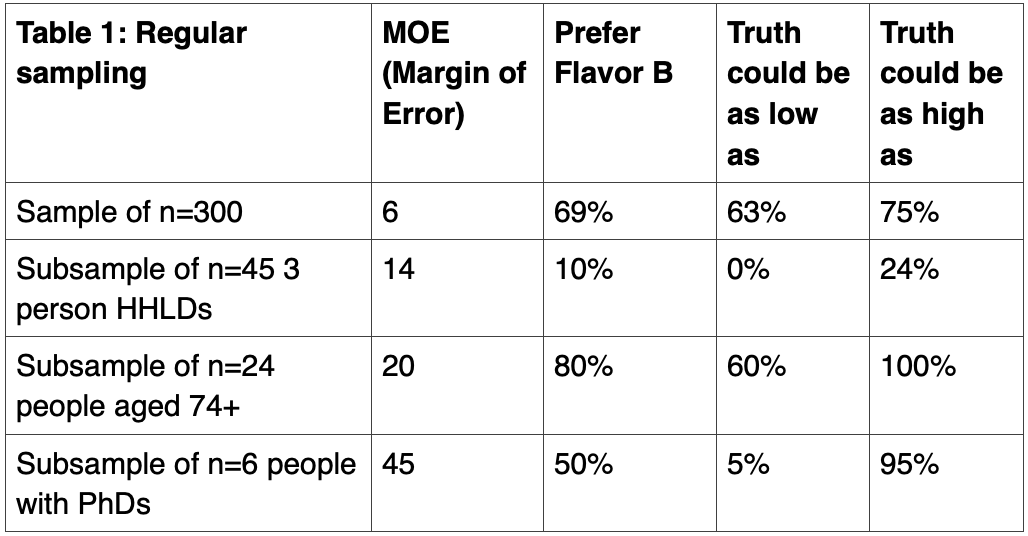
However, interpreting results from the subsamples isn’t simple. Because of their high margins of error, it’s difficult to feel confident about what flavors people prefer. People in three-person HHLDs probably prefer flavor A, as the highest margin of error suggests that up to 25% may prefer flavor B. Meanwhile, people aged 74+ likely prefer flavor B. However, people with PhDs could easily prefer A or B. It’s impossible to know. The huge margins of error for the small subsamples completely obscure true preferences.
Oversampling Brings Confidence to Decision Making
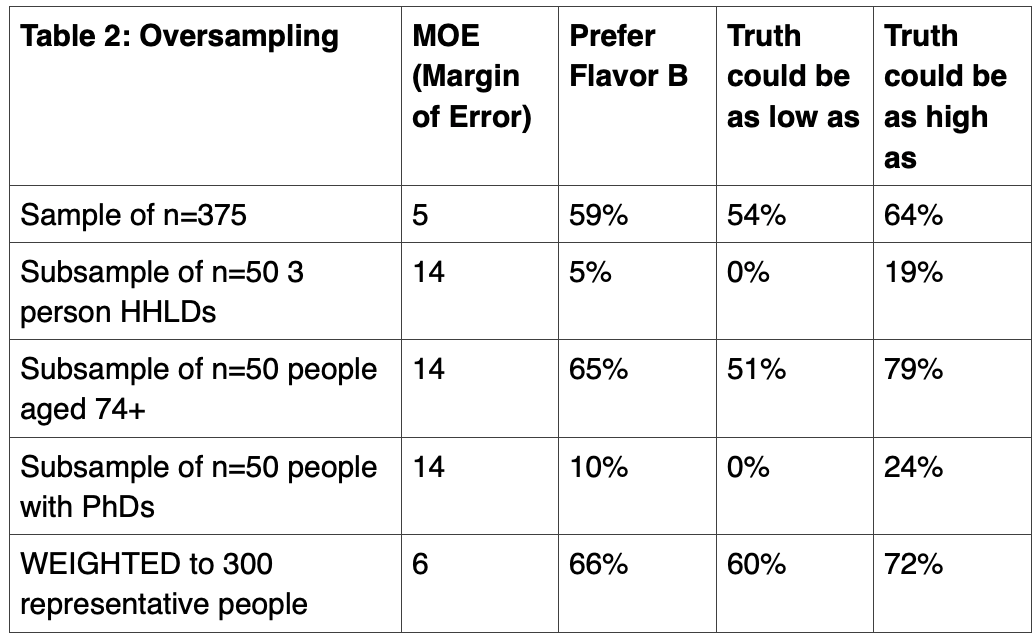
Now, let’s do things differently. Let’s still draw a random sample of 300 people because we need to preserve the demographic characteristics and representation of the population within an appropriately sized sample. But this time, let’s add additional people so that each of the subsamples has 50 people. To the 300, we’ll oversample by 5 people in three person HHLDs, 26 people aged 74+, and 44 people with PhDs for a new total of 375 people.
These additions mean that people in three-person households now make up 13% instead of 15% of the sample, people aged 74+ now make up 13% instead of 8%, and people with PhDs now make up 13% instead of 2%. By increasing each subsample to 50 people, we’ve lost population representativeness, but we’ve improved margin of error.
Now that we have larger subsample sizes, Table 2 shows more precise preference scores among the subsamples: only 5% of people in 3 person HHLDs, 65% of people aged 74+, and 10% of people with PhDs prefer B. After considering the margins of error, we realize that people in 3 person HHLDs prefer A, people aged 74+ prefer B, and people with PhDs prefer A. And, among the entire 375 people, 59% prefer B.
How to Ensure Oversampling Doesn’t Bias Results
Although we can determine that 59% of the 375 people prefer B, this score does not reflect the population because we oversampled on three characteristics. Instead, we need to report a preference score where people in 3 person HHLDs are 15% not 13% of the sample, people aged 74+ are 8% not 13%, and people with PhDs are 2% not 13%.
By weighting the total results back to these percentages, we can determine that 66% of the total sample prefers flavor B. With the margin of error, we know that truth probably lies somewhere between 60% and 72%. We can feel confident that the population would prefer flavor B.
Oversampling gave us two major benefits. First, we discovered that using insufficiently small sample sizes led to overestimated preferences for flavor B among the subsamples. And, we slightly overestimated the overall preference for flavor B among the total sample. By leveraging oversampling, we reduced sample bias and increased precision for both the total sample and the three subsamples.
Summary
Choosing among flavors, shapes, sizes, and colors isn’t necessarily earth-shattering but it can be. For instance, we might need to understand which package shape would make it easier for people to open their medications, which set of instructions would convince more people to finish their medications, or what color signage would draw people into a healthcare facility. There are endless business and research situations wherein it is profoundly important that precision through oversampling and weighting is achieved.
Oversampling and weighting aren’t easy concepts to grasp, and they aren’t statistically simple to implement. Fortunately, because we have specialized software and expert statisticians on our side, most researchers only need to understand why oversampling and weighting are important, how they generally work, and when to report weighted and unweighted results.
If you’re interested to learn more about sampling and weight, please get in touch with one of our survey experts. We’d be happy to help you navigate this essential technique!